Visual Anchor Charts for Next Generation Science Standards
Creating Visual Anchor Charts for NGSS Success
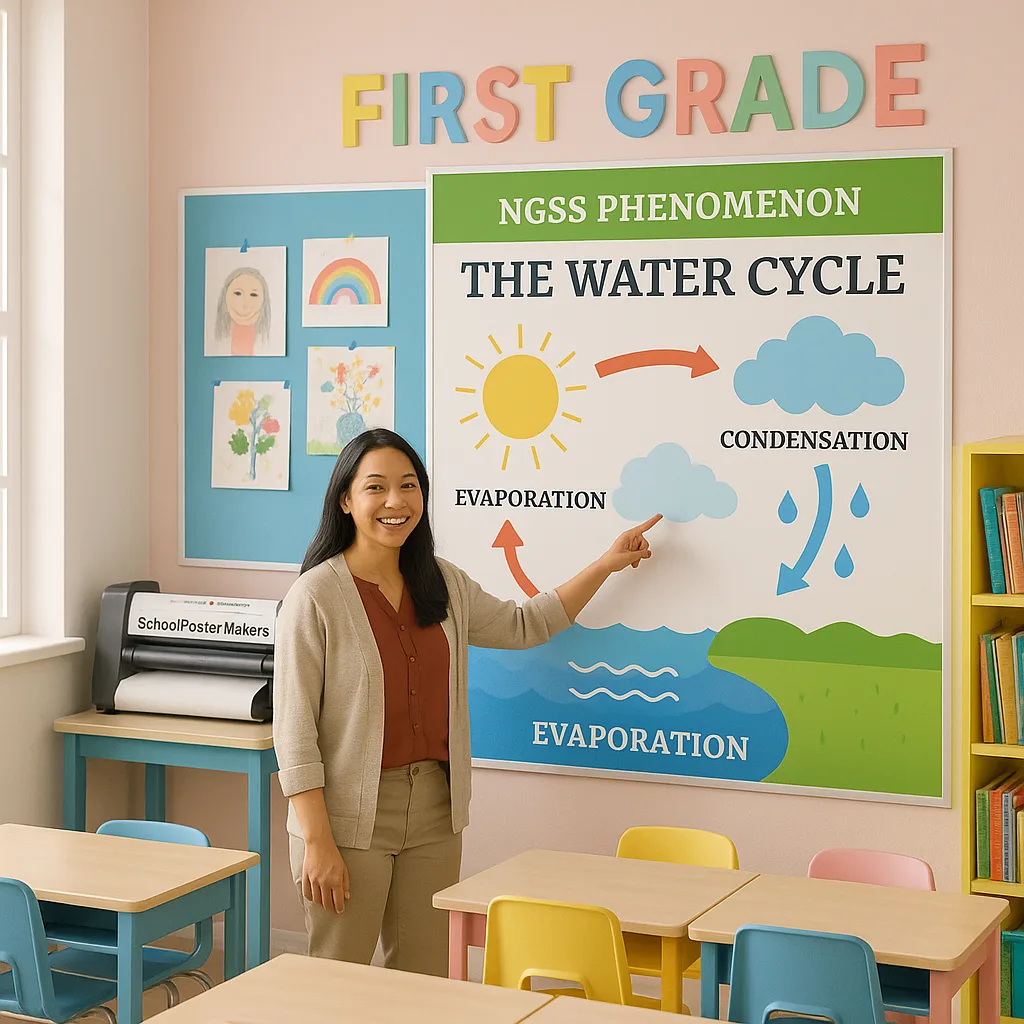
Oh my goodness, friends! Can I just share how excited I get when I see those lightbulb moments happening in my first grade classroom? Yesterday, one of my students pointed to our phenomenon board and explained to her reading buddy why ice melts faster on the blacktop than on grass. My teacher heart just soared! Creating visual anchor charts that align with Next Generation Science Standards has completely transformed how my little scientists engage with big ideas. Today, I’m thrilled to walk you through exactly how to use your poster print machine science standards materials to create inquiry-based visuals that stick!
Understanding NGSS and Visual Learning in First Grade
Let me be honest – when I first heard about NGSS during my student teaching, I felt a bit overwhelmed. But here’s what I’ve learned: these standards are actually a gift for visual learners! They emphasize understanding phenomena through observation and questioning, which is exactly how six and seven-year-olds naturally explore their world.
In my classroom, I’ve discovered that visual anchor charts serve as powerful thinking tools. Rather than just decorating our walls, these charts become interactive reference points that students return to again and again. When we’re investigating why shadows change throughout the day, my students can point to our visual models and use them to support their explanations.
The beauty of using a Campus Pro 24 Poster Maker for these charts is that I can create them quickly and update them as our understanding evolves. No more spending my weekends hand-drawing charts that might only last one unit!
Essential Design Principles for NGSS Anchor Charts
Creating effective science visuals isn’t just about making things pretty – it’s about supporting deep thinking and inquiry!
Clarity First
Use large, clear text and simple diagramsKeep It Simple
Break complex ideas into bite-sized visual chunks. For first graders, less is definitely more! I limit each poster to one main concept with 3-5 supporting details.Color Coding
Use consistent colors for categoriesStrategic Colors
I use green for living things, blue for water/weather, and orange for energy concepts. This consistency helps students make connections across units!Visual Hierarchy
Make important info stand outGuide the Eye
Use size, color, and placement to show relationships. Main ideas get the biggest space, supporting details branch out like a mind map.Creating Phenomenon Boards That Spark Wonder
One of my favorite NGSS practices is anchoring learning in phenomena – those amazing things we observe in the world that make us go “Wow, why does that happen?” In first grade, these phenomena need to be directly observable and relatable to their everyday experiences.
Last month, we explored the phenomenon of frost patterns on windows. Using our Campus Pro 36 Poster Maker Advanced Package, I created a stunning phenomenon board featuring actual photos of frost from our classroom windows (thank you, winter mornings!). The large format allowed students to see intricate details they might miss otherwise.
 chart designed for first graders, three distinct sections in pink, blue, and green. The chart should show simple icons and child-friendly")
Poster Print Machine Science Standards: CER Charts
Now, let’s talk about one of my absolute favorite tools for developing scientific thinking: Claim-Evidence-Reasoning (CER) charts! These visual organizers help my first graders structure their thinking in a way that builds strong scientific communication skills from the start.
Here’s my go-to format that works beautifully with banner printing machines:
What do I think is happening? Students draw or write their hypothesis in simple terms.
What did I observe? Space for drawings, photos, or data collection tallies.
Why does my evidence support my claim? Connection statements with sentence starters.
Pro tip: I create reusable CER templates using our poster maker, then laminate them so students can use dry-erase markers for different investigations. This saves paper and lets us practice the thinking process repeatedly!
Engineering Design Process Visuals
Oh friends, watching first graders work through the engineering design process fills my heart with joy! They’re natural problem-solvers, and visual guides help them understand that engineering is really just organized creativity.
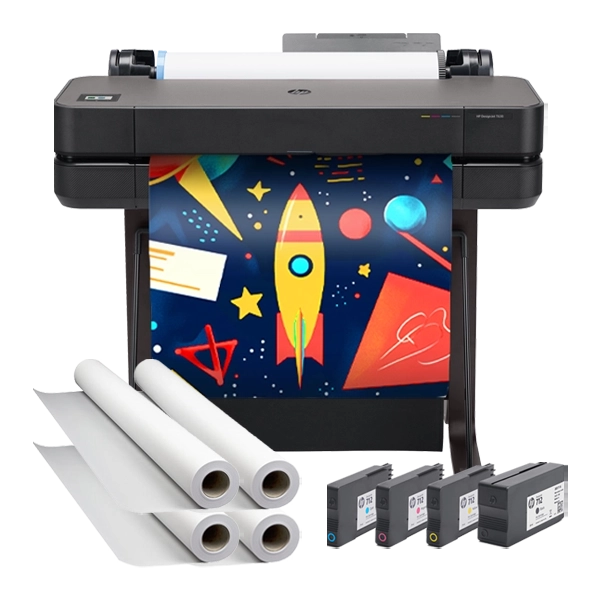
I’ve created a circular engineering design poster that shows the process isn’t linear – we can always go back and improve! Using vibrant colors from our poster print machine science standards collection, each step gets its own section:
Step-by-Step Process for Creating Your Own Charts
Sketch your layout on paper first
Create in design software
Use quality poster paper
Place at student eye level
Real Classroom Examples That Work
Let me share some success stories from my classroom and teacher friends who’ve embraced visual NGSS learning!
Life Cycles Made Visible: My teaching partner created an interactive butterfly lifecycle chart using banner printing machines to produce a 3-foot wide display. Students could move velcro pieces to show each stage, and we added real photos from our classroom butterfly garden. The size made it perfect for small group discussions!
Weather Pattern Tracking: We use a weekly weather observation chart printed on durable outdoor material. Students record daily observations with symbols and colors. After a month, patterns become crystal clear! This hands-on data collection perfectly aligns with NGSS K-ESS2-1.
Forces and Motion Ramps: For our unit on pushes and pulls, I created visual procedure cards showing different ramp heights and predicted outcomes. Students use these as reference while conducting experiments, supporting both literacy and science skills.
Perfect for Classroom Charts!
The Classroom Pro 24 Poster Maker Advanced Package includes ink and paper for vibrant classroom posters.
The Classroom Pro 24 Advanced Package fits perfectly on my desk for quick chart creation!
Downloadable Templates and Resources
I’ve learned that sharing is caring in our teacher community! Here are template ideas you can adapt for your classroom:
• 5E Model lesson flow chart
• Investigation recording sheets
• Science vocabulary word walls
• Data collection graphs
• Question stems for discussions
• NGSS dimension icons
• Arrow sets for cycles
• Weather symbols
• Plant/animal outlines
• Safety reminder graphics
Tips for Maximizing Your Poster Print Machine Science Standards
After a year of creating NGSS-aligned visuals, I’ve gathered some practical tips that make a huge difference:
Paper Selection Matters: For charts that students will interact with frequently, I use the heavyweight coated paper. It stands up to sticky notes, pointing fingers, and occasional water spills during science experiments!
Size for Purpose: Investigation procedures work great at 18″x24″, while phenomenon boards shine at 36″ wide. Our whole-class anchor charts are typically 24″x36″ – large enough for everyone to see but manageable to move.
Lamination is Your Friend: I laminate templates and frequently-used charts. Students can write on them with dry-erase markers, making them reusable across multiple lessons. This sustainable approach has saved both money and prep time!
Student Ownership: Whenever possible, I involve students in creating parts of our charts. They might draw observation sketches or help choose colors for different sections. This investment makes them more likely to use the charts as thinking tools.
Making the Most of Your Visual Learning Journey
Friends, creating visual anchor charts for NGSS doesn’t have to be overwhelming! Start small with one phenomenon board or a simple CER template. Watch how your students engage with these visual tools, and let their curiosity guide your next creations.
Remember, the goal isn’t perfection – it’s connection! When students can see their thinking represented visually, when they can point to evidence on a chart, when they proudly explain a concept using our classroom posters, that’s when the magic happens.
Whether you’re using a desktop poster print machine science standards setup or larger banner printing machines for hallway displays, the key is making science visible, accessible, and exciting for our young learners. Your classroom walls can become windows into scientific thinking!
Ready to transform your science teaching with professional-quality visual aids? Explore our complete range of school poster makers and discover how easy it is to create NGSS-aligned materials that inspire young scientists. Happy teaching, friends! 🌟